|
|
 |
|
Written by: Mathias Andersen
|
Power BI Product Images |
|
|
|
Make your Power BI reports more visual with product images
Most Power BI reports rely heavily on item numbers, names, and text-based information.
While this works technically, it often slows people down in practice.
By adding product images directly to Power BI tables and lists, you turn abstract item data into something instantly recognizable.
Instead of asking “Which item is this?”, users can immediately see it.
Just like you wouldn’t create a webshop without product images, you shouldn’t create a Power BI report without them either—especially when the target audience is salespeople.
|
|
|
| Talk to your specialist |
|
|
|
|
Why product images make a real difference
|
|
|
|
When users work with hundreds or thousands of items, images help them: |
|
|
-
Recognize products faster
-
Reduce mistakes between similar items or variants
-
Navigate large item lists with more confidence
-
Engage more with the report (it simply feels easier to use)
|
|
A table with images often feels less like a “report” — and more like a product overview or catalog. |
|
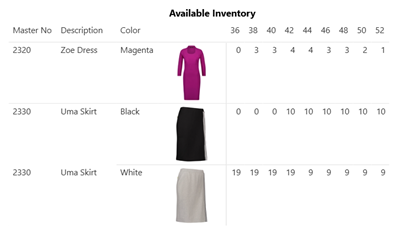
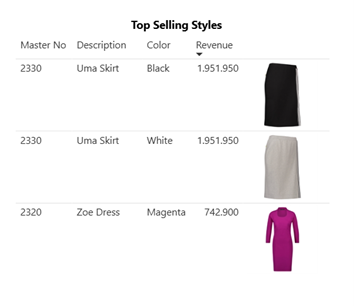
Examples
Here are a few examples of what it could look like in Power BI: |
|
|
 |
|
|
 |
|
|
| Get in touch! |
|
|
Quick guide to get started
Identify where to get your product images
Product images can come from many sources, for example:
|
|
|
|
The key is knowing where the source of truth for product images lives.
|
|
|
|
Make the images suitable for Power BI
If your images are already available via a URL, you’re good to go.
If you rely on image files instead, be aware of image size and resolution. Power BI does not handle large, high‑resolution images well when they are imported directly—it may crop the image or impact performance.
If your images are too large and not available via a link, you can automatically compress and prepare them using Power Automate, ensuring they work smoothly in Power BI.
Add the image URL (preferred) or import images into Power BI
Using image URLs is the recommended approach.
Microsoft’s official guide explains how to add images to tables and matrix visuals in Power BI:
https://learn.microsoft.com/en-us/power-bi/create-reports/power-bi-images-tables
Once the images are available in your model, identify the Power BI reports where visuals would add the most value and add the image as a column in a table or matrix visual. |
|
|
|
Can't get Enough of Power Platform?
For complete coverage of Power Platform updates, we invite you to follow TRIMIT's LinkedIn page for additional TRIMIT BI updates and insights:
👉 Linkedin
Know colleagues who would benefit from these updates?
Please share this email so they can stay in the loop too!
They can sign up right here
👉 Sign me up!
|
|
|


